We took the time to carefully design a report that not only prints onto a few pages, but actually makes the overall reporting process easier. Reporting shouldn’t take hours upon hours of your day. Reporting should be a quick and easy assessment of your patient’s performance in a 1 – 2 page report.
Therapists can access these reports from the results section of a patient file.
Using the printed form of your Patient’s Report will allow you to easily explain and visually share your patient’s progress with them and their caregivers.
It can also help you to see where they are struggling and to adapt your therapy accordingly.
The printed report is set to be used as an 8.5 x 11 print sheet of paper. It is best if it is printed in color or viewed by a screen. In this section, we are going to explain how to interpret your patient’s report.
One of the ways you can track the efficacy of a cognitive program is to look at the patient’s accuracy rate. When the patient performs exercises at an accuracy rate higher than 80%, they will receive a green rating. If it is lower than 80% but higher than 50%, they will receive a yellow rating. If it is less than 50%, they will receive a red rating. These ratings correspond to mastery, intermediate, and poor performance.
Red
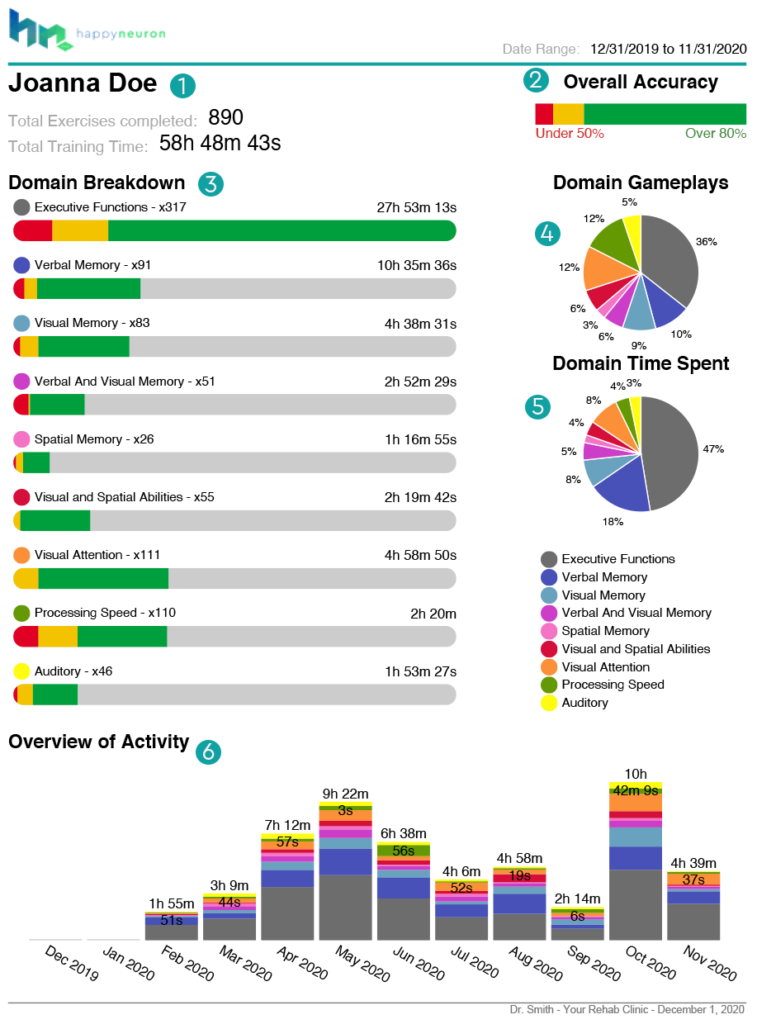
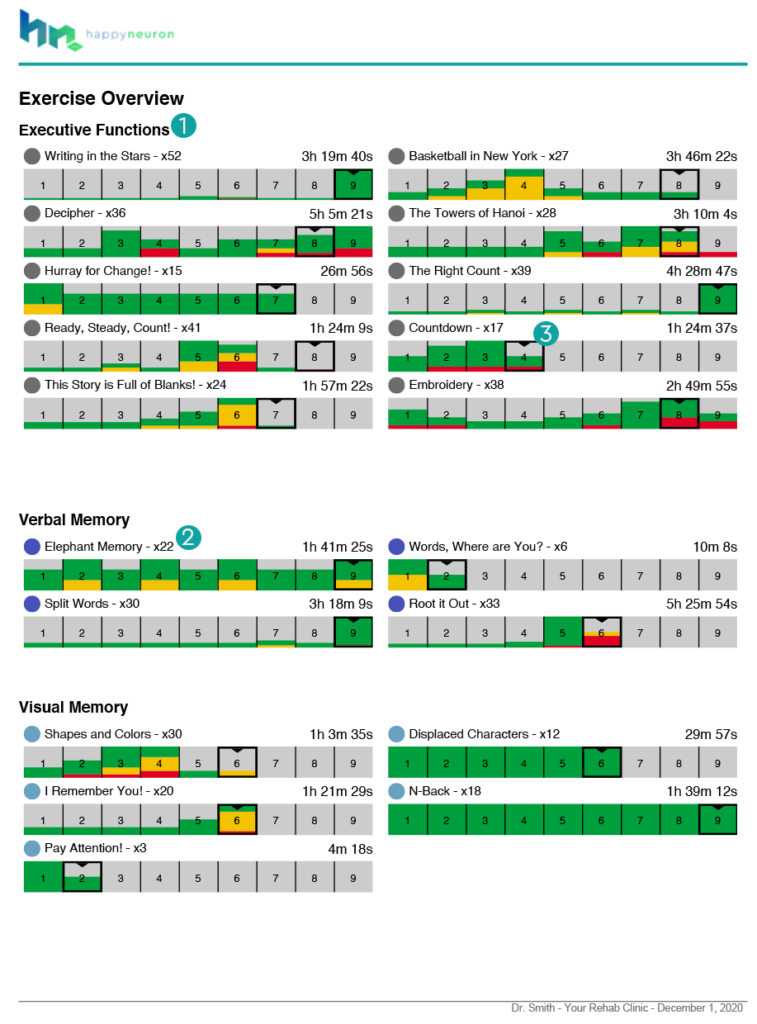
Seeing a lot of red within a client’s chart means that the client is performing poorly more than they are succeeding. This, however, does not mean the patient cannot succeed while performing a specific exercise. It indicates that the client is being challenged, which the therapist should address by discussing and building new or revisiting some previously explained cognitive strategies. Some red is normal and is desirable because it indicates that your patient is being appropriately challenged.
Yellow
Yellow indicates that your client is being appropriately challenged. When your client performs at a yellow level, they may need some guidance to optimize the cognitive strategy that they are employing. This may look like addressing anxiety in regards to performing an exercise within a given time constraint or helping your client be more attentive to detail. When your client optimizes the strategy that they are employing, they will be able to perform exercises demonstrating mastery which will show up with increased “green” in their reporting.
Green
When a client has high amounts of green in their chart, it means that they are performing the exercises with mastery of accuracy and response time. When your client demonstrates mastery, applaud them for their success! You may want to try having your client perform exercises at more difficult levels, or use the Scheduled Exercises feature to adjust the Advanced Settings within an exercise to create a more customized challenge for your client. If you challenge your client at a more difficult level and they have difficulty, do not be discouraged. The challenge is what brings growth. In time, they will master the next level gracefully!
Please note: All exercises begin at Level 1. Therapists can change the levels of exercises to have their clients perform them at more difficult levels. If a client struggles at a more difficult level, the therapist may move the level of an exercise to a less challenging level, if desired. When reviewing a client’s chart, do not be alarmed if you see that your client is performing exercises with difficulty, as indicated by seeing red and yellow within their chart. This indicates that your client is being challenged, and that you need to guide them in developing, employing, and optimizing the cognitive strategies needed to demonstrate mastery in solving the exercises.
In this section of the report, you will find a broad overview of what is occurring within your patient’s account, from which domain they spend the most time on, to which domain they play the most exercises in. On this page, you can quickly and efficiently view the overall activity within a client’s account.
In this section you will be able to find:
This section takes the average accuracy rate of all the exercises completed during the period.
This section is to help you quickly view the following:
These pie charts can help you quickly understand which domain your client is spending the most time on and which domain they are completing the most exercises.
The purpose of this section is to look at the exercises played based upon the day of completion. Depending on the date range, this breakdown will either show monthly, weekly, or daily usage. This example displays performance of exercises over a large range of dates which is displayed in a monthly time frame.
This section of the report is a more detailed explanation of each exercise completed by your patient. Each exercise that they have completed is displayed here. The length of this section may vary, depending on how many exercises they have completed during the period you have selected.
We have broken apart this section first by the cognitive domains and then the exercises within each cognitive domain.
This section showcases:
This section is the goldmine of the entire report. It helps you quickly view the following:
This page allows for you to quickly and accurately see the overall success rate of your patient. It allows you to see if they have regressed, or if they are continuing forward and improving.
Learn more:
Info Page Title 1
Info Page Title 2
Info Page Title 3
Pulling from our decades of experience in Cognitive Therapeutics, we aim to help you enrich your practice through the use of digital and paper tools.
Pricing + Offers
© 2023 HappyNeuron is a Product of Humans Matter